
02 Jul How to Install Cacti Monitoring Server With Nginx
Jul 2, 2015 – 2 min read
Introduction
Cacti is an open-source, web-based network monitoring and graphing tool designed as a front-end application for the open-source, industry-standard data logging tool RRDtool. Cacti allows a user to poll services at predetermined intervals and graph the resulting data. It is generally used to graph time-series data of metrics such as CPU load and network bandwidth utilization.`{`2`}` A common usage is to monitor network traffic by polling a network switch or router interface via Simple Network Management Protocol (SNMP). – Wikipedia
In this tutorial we will:
- Install Cacti.
- Configure Cacti to work with Nginx.
- Configure Cacti.
- Create devices and graphs.
All commands below are for Debian/Ubuntu Linux distribution.
Install Nginx
To install Nginx execute the command below.
Install SNMPD Service
SNMPD Service is used by Cacti, so it is a required component in order Cacti to work as expected. Let’s install it.
After the installation we have to do a few configurations.
Find the row:
and change it to:
Save and close the file. Open the configuration file:
For section “AGENT BEHAVIOUR” comment out the line for “connections from the local system only” and uncomment the line “connections on all interfaces”.
Find the row:
and uncomment it.
Next, search for and find “ACCESS CONTROL” section and add the following record. We will be changing this to reference our specific Cacti server. Use either your cloud server’s domain name or its IP address.
For example (if the IP address of our server is 1.1.1.1):
Save and close the file.
The next step is to install MIB files. Here is short information about MIB:
A management information base (MIB) is a database used for managing the entities in a communications network. Most often associated with the Simple Network Management Protocol (SNMP), the term is also used more generically in contexts such as in OSI/ISO Network management model. While intended to refer to the complete collection of management information available on an entity, it is often used to refer to a particular subset, more correctly referred to as MIB-module.
Let’s install it:
Usually the installation should go with no issues but if you get this error “E: Package ‘snmp-mibs-downloader’ has no installation candidate”, that means that your are missing a source.list link. Let’s add it.
At the end of the file add:
Save and close the file. Try to install it again. This time it should work! When you are ready with the installation of MIB files, restart SNMPD service.
Install Cacti Monitoring Server
Let’s start with:
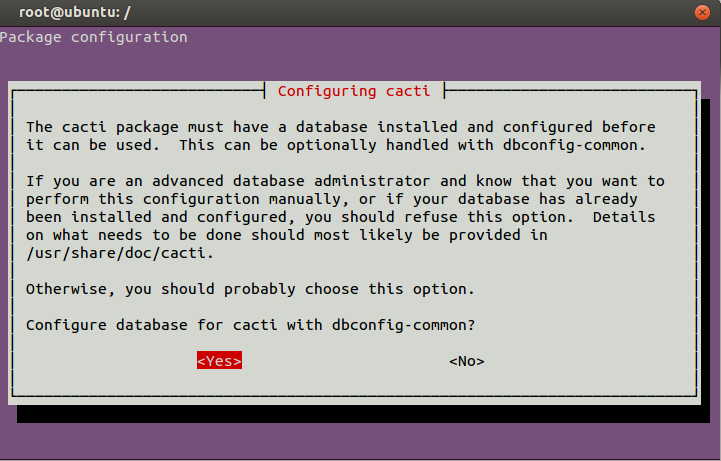
During the installation of Cacti, you will be asked if you’d like dbconfig-common to setup MySQL for Cacti automatically. This creates a user and database for Cacti, and then imports the necessary data.
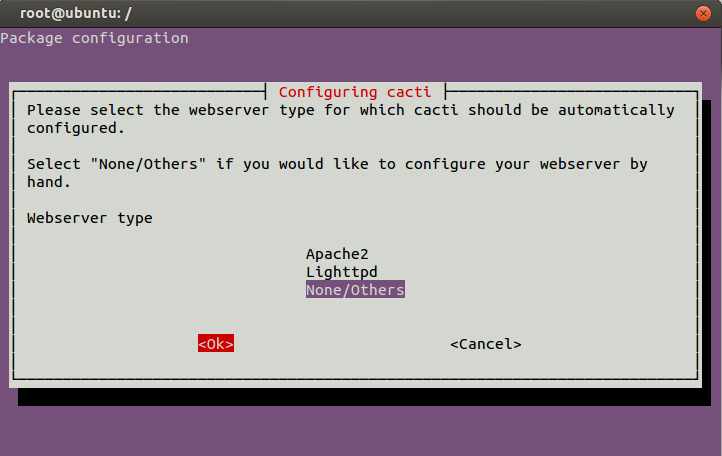
You also will be asked to choose Web service. In our case choose “None/Others” because we will configure it to work with Nginx.
Configure Cacti with Nginx
Let’s assume that in our case /var/www is the home directory where are located the websites which are pointing to our server. Let’s also assume that we would like to access Cacti from the domain name example.com. Let’s go to the home directory and create a directory for this domain name.
Now we have to create a record in “sites-available” in order Nginx to be able to handle requests sent from outside world to this domain. Let’s go to this directory and create a new file for the domain.
Add the following code inside the file.
With the help of this configuration Nginx knows that all requests to the IP address of our server for this domain name and on port 80 must be forwarded to directory /var/www/example. Save and close the file.
Restart Nginx.
Let’s go to the public directory for this domain.
Now we have to create a soft link between a sub-directory inside this domain name and the Cacti installation.
This approach is helpful for those cases when the domain name example.com already has an installed website, for example a blog or another web system, and we would like to access Cacti from example.com/cacti.
But if we want Cacti to be installed on a separate domain then we have to create the soft link between the directory example and the Cacti installation.
When you are ready, you have to set up the correct permissions for the directory. In our case let’s assume that we have chosen the first option, to access Cacti from a sub-directory.
One-Time Setup of Cacti Monitoring Server
Open your web browser and type the domain name in order to access the Cacti Monitoring Server. In our case this is: example.com/cacti. The first time when you open this domain you will see the screen displayed below.
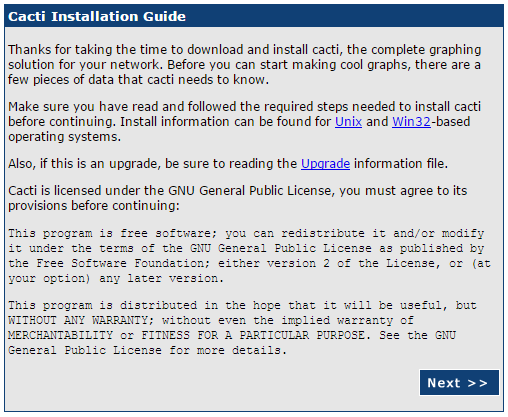
Choose “Next”.
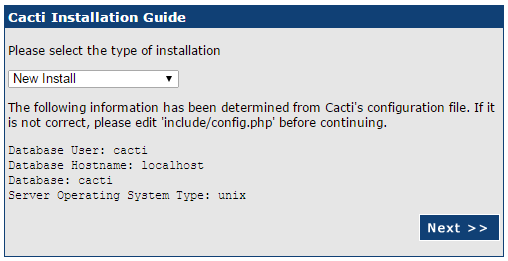
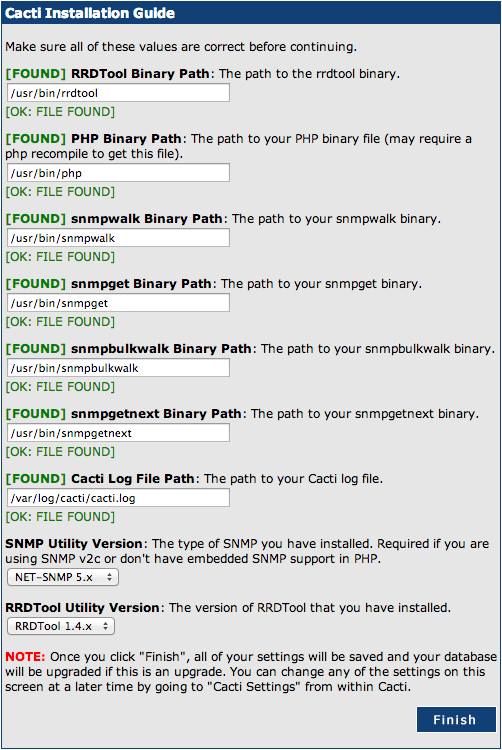
The next page shows the application paths of the “helper” applications that Cacti uses to operate. All of the applications should be green and marked with “[FOUND]”. Click “Finish” to continue.
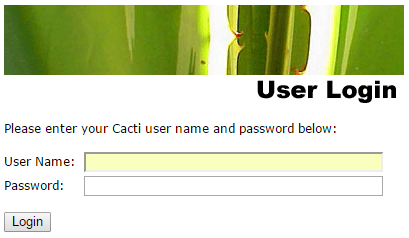
Next, you’ll be asked to enter the Cacti username and password. These are not the passwords you entered during installation. Instead, enter the following default values.
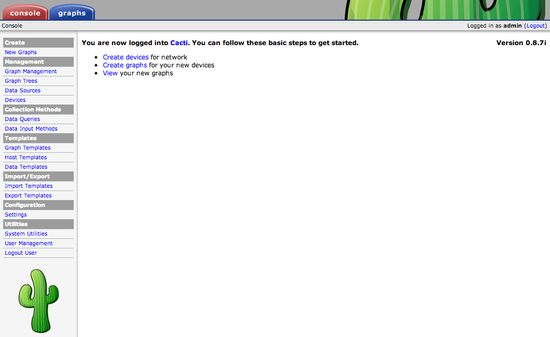
You are now on your Cacti page.
Configure Cacti
A few options must be changed to ensure that Cacti produces data correctly. On the left-hand navigation panel, click on “Settings” under the Configuration heading.
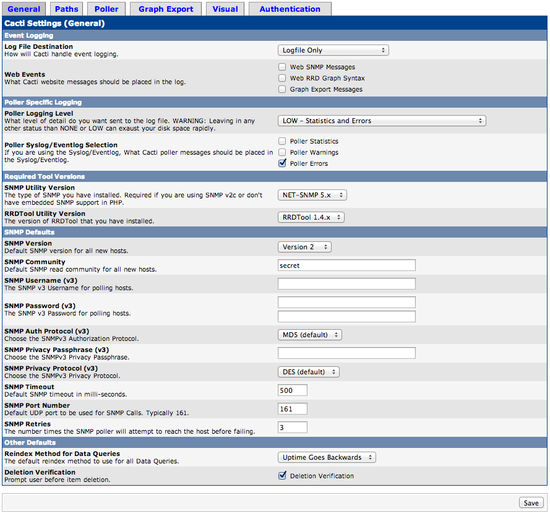
In the General tab, we want to change some parameters. Change these settings to match what is shown here. Click “Save” when finished.
Next, click the “Poller” tab on the navigation settings. Change these options and match what is shown here. Click “Save” when finished.
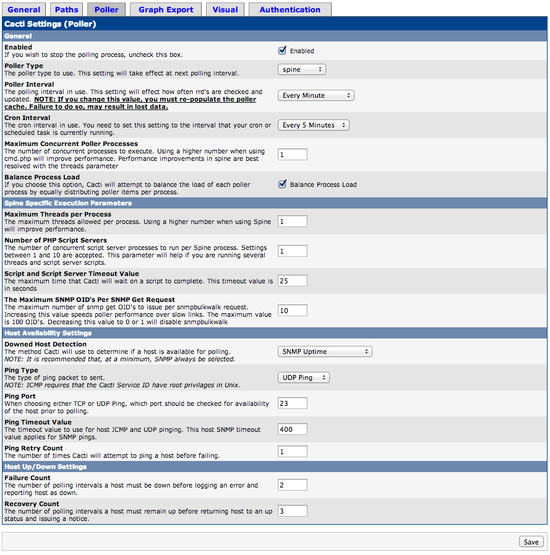
Whenever the Poller Interval is changed, the cache must be emptied. To do this, click “System Utilities” under the Utilities heading.
Click on “Rebuild Poller Cache” to empty the cache.
Creating Devices and Graphs
To begin graphing, we need to set up device profiles and tell Cacti what to graph. Click “Devices” from the main left menu. In the upper-right corner of the page, click the “Add” button to add a new device. Now we have to fill in the fields displayed below. Click “Create” when you are ready.
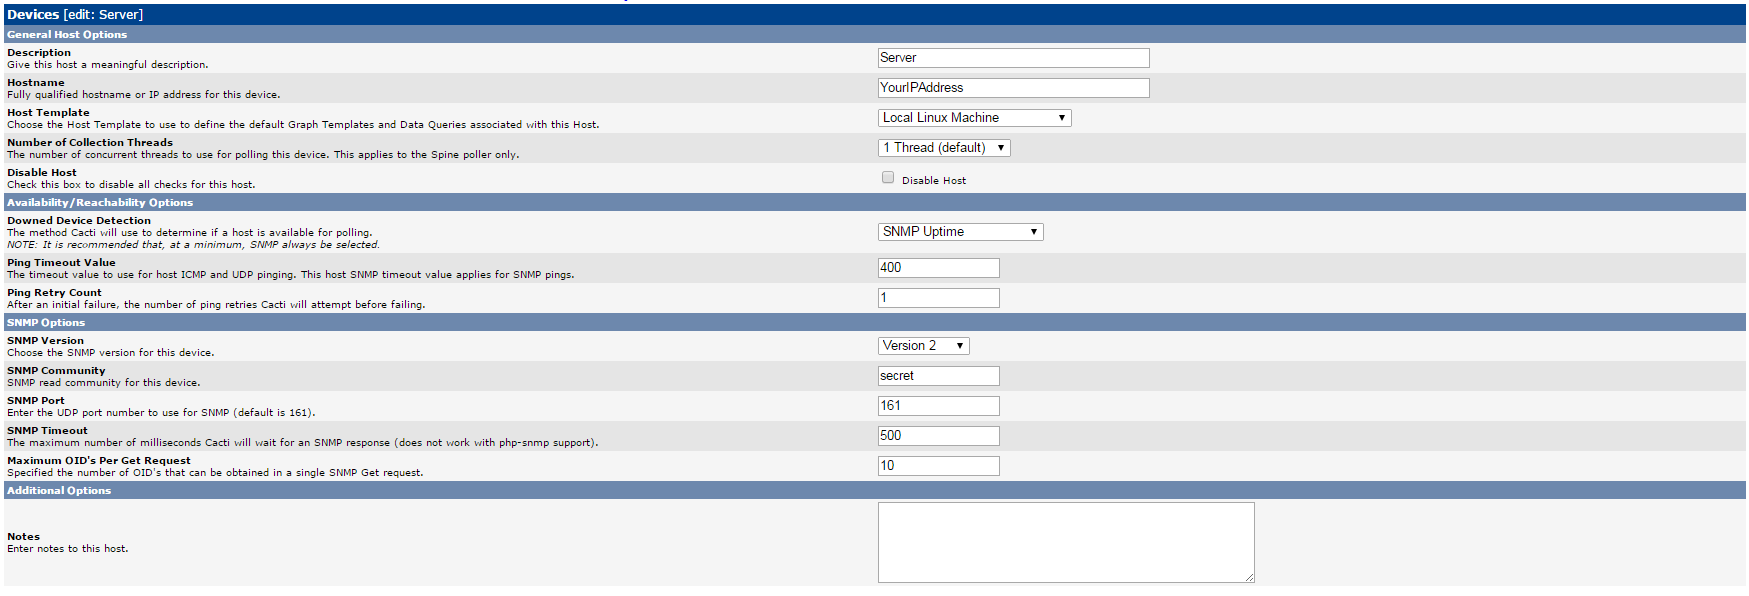
If you see SNMP error in red at the top of the page, restart snmpd service from the Linux console. Click “Save” again when you are ready.
Next, scroll down and create some associated graph templates and associated data queries.

Click “Create” at the bottom of the page when you are ready.
If you want like to change the graphs and the data collectors, click “Devices” from the left main menu and choose the device which you want to change. At the top of the page you will see three buttons: “Create Graphs for this Host”, “Data Source List” and “Graph List”. Choose “Data Source List” or “Graph List” in order to change the data sources or the graphs.
In order to see the data collected by Cacti, click “Graphs” tab at the top of the page. The collection of data might take a while (5 to 10 minutes) so if you come back in few hours you will see colorful graphs displaying the collected data.
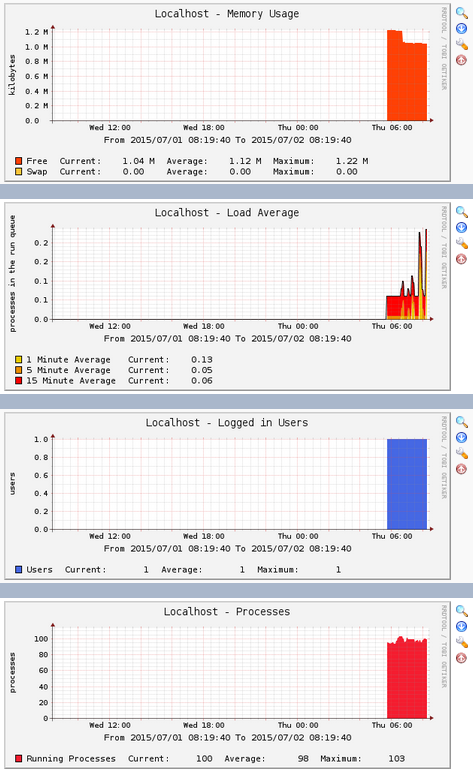
All ready! We have Cacti Monitoring Server up and running. Click on each graph to show daily, weekly, monthly, and yearly graphs for that same resource.
If you need assistance with Cacti, contact me.
(The header image is taken from DigitalOcean website.)
